What is the total cost curve?
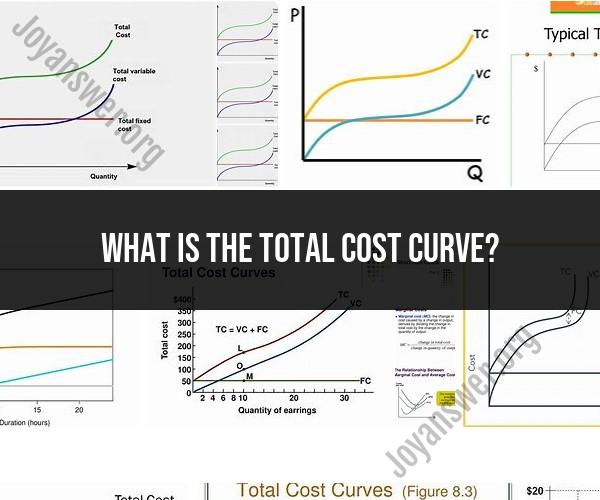
In economics, the total cost curve is a graphical representation of the relationship between the total cost incurred by a firm in producing a certain quantity of output and the quantity of output produced. It is a fundamental concept in cost analysis and plays a significant role in the decision-making process for businesses. Here are the key components and characteristics of the total cost curve:
Total Cost (TC): Total cost refers to the overall cost incurred by a firm to produce a specific quantity of goods or services. It includes both fixed costs (costs that do not vary with the level of production) and variable costs (costs that change as production levels change).
Quantity of Output: The horizontal axis of the total cost curve represents the quantity of output produced by the firm. This can be measured in units, quantity of products, or any relevant production metric.
Shape of the Total Cost Curve: The shape of the total cost curve varies depending on the firm's cost structure and production efficiency. However, it typically exhibits the following characteristics:
Initially, as the firm increases its production output, the total cost curve rises at a decreasing rate. This means that the total cost per unit of output (average total cost) is decreasing. This portion of the curve represents economies of scale, where increased production leads to lower average costs.
At some point, the total cost curve starts to rise at an increasing rate. This indicates that the firm is experiencing diseconomies of scale, where further increases in production result in higher average costs.
The lowest point on the total cost curve corresponds to the minimum point of the average total cost curve (the point of cost efficiency). At this point, the firm is operating at its optimal production level.
Marginal Cost (MC): The marginal cost curve is closely related to the total cost curve. It represents the additional cost incurred by the firm when producing one more unit of output. The marginal cost curve intersects the total cost curve at the minimum point of the latter.
Fixed and Variable Costs: The total cost curve is the sum of fixed and variable costs. Fixed costs do not change with changes in production levels and are represented by a horizontal line on the total cost curve. Variable costs increase as production levels increase, leading to the upward-sloping portion of the curve.
Understanding the total cost curve is essential for firms to make decisions about production levels, pricing strategies, and cost management. By analyzing the curve, businesses can identify their optimal production quantities and pricing points that maximize profitability.
