What is a cost curve?
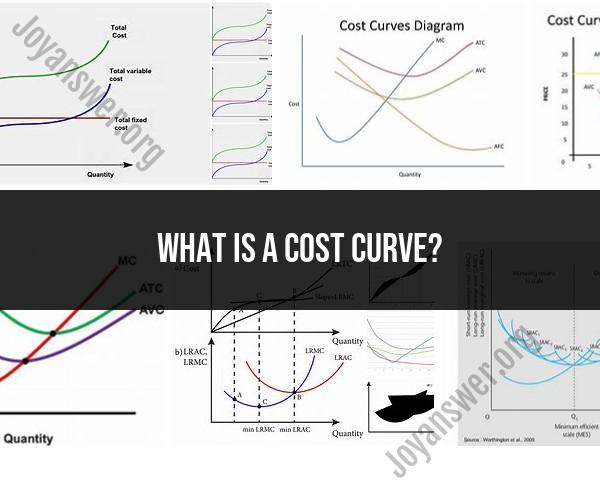
A cost curve in economics is a graphical representation that shows the relationship between the quantity of goods or services produced (output) and the corresponding costs incurred by a firm or producer. Cost curves are fundamental tools used in microeconomics to analyze and understand the cost structure of a business or production process. They provide valuable insights into how costs change as production levels vary.
Here are the key components and types of cost curves:
Quantity Produced (Output): The horizontal axis of a cost curve represents the quantity of goods or services produced by a firm. This can be measured in units, such as the number of widgets, or in other appropriate measures, depending on the industry or context.
Costs: The vertical axis represents the various costs incurred by the firm. These costs are categorized into different types, each of which contributes to the total cost of production.
Total Cost (TC): The total cost curve (TC curve) shows the relationship between the quantity produced and the total cost incurred by the firm. It generally starts at the origin (0,0) because when no units are produced, there are no costs.
Fixed Costs (FC): Fixed costs are the costs that do not change with changes in production levels. These costs are incurred even if a firm produces zero units. Fixed costs are represented by a horizontal line on the cost curve because they remain constant regardless of output.
Variable Costs (VC): Variable costs are the costs that change with changes in production. As production increases, variable costs also increase. Variable costs typically include expenses such as labor, materials, and utilities.
Average Total Cost (ATC or AC): The average total cost curve (ATC curve) shows the average cost per unit of production. It is calculated by dividing total cost (TC) by the quantity produced. Mathematically, ATC = TC / Quantity Produced.
Marginal Cost (MC): The marginal cost curve (MC curve) represents the additional cost incurred by producing one more unit of output. It is calculated by the change in total cost when one additional unit is produced. Mathematically, MC = ΔTC / ΔQuantity Produced.
Types of Cost Curves:
Average Fixed Cost (AFC): The average fixed cost curve (AFC curve) represents the fixed cost per unit of production. It is calculated by dividing fixed costs (FC) by the quantity produced. Mathematically, AFC = FC / Quantity Produced.
Average Variable Cost (AVC): The average variable cost curve (AVC curve) represents the variable cost per unit of production. It is calculated by dividing variable costs (VC) by the quantity produced. Mathematically, AVC = VC / Quantity Produced.
Cost curves provide essential information for firms to make production decisions, set prices, and determine profit-maximizing levels of output. They also help economists analyze market competitiveness and the efficiency of resource allocation in different industries. Understanding cost curves is crucial for both businesses and policymakers in the field of microeconomics.
