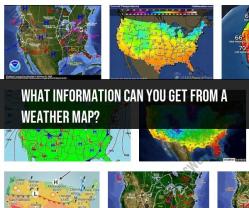
What information can you get from a weather map?
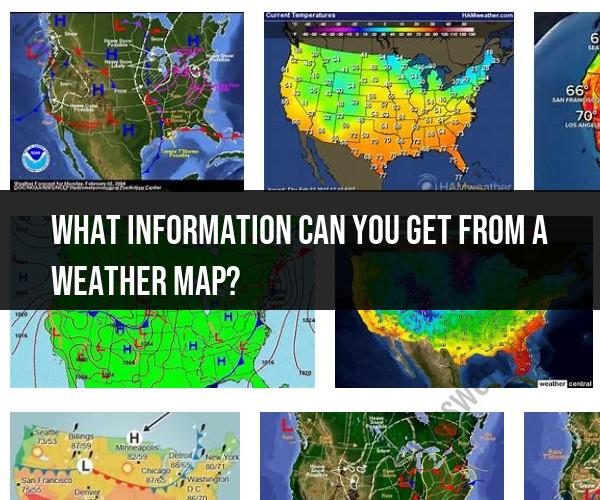
Weather maps are visual representations of meteorological data that provide valuable information about current and future weather conditions. Here are some of the key types of information you can gather from a typical weather map:
Temperature: Weather maps often display temperature data. Isobars, lines connecting points of equal temperature, help identify areas of warm and cold air masses. Cold fronts and warm fronts are shown on the map, indicating the boundary between different temperature air masses.
Pressure: Isobars on a weather map also represent atmospheric pressure patterns. Areas of high pressure (anticyclones) are associated with fair weather, while low-pressure systems (cyclones) are often associated with stormy or unsettled conditions.
Wind: Wind patterns are usually indicated by arrows on weather maps. The direction of the arrows shows the wind's prevailing direction, and the length or thickness of the arrows indicates wind speed. This information helps in understanding wind patterns and their influence on weather.
Precipitation: Weather maps may include symbols or shading to depict different types and amounts of precipitation, such as rain, snow, sleet, or hail. This information helps you anticipate when and where precipitation is expected.
Cloud Cover: Cloud cover is often represented on weather maps using symbols or shading. Understanding cloud cover helps predict whether the sky will be clear, partly cloudy, or overcast.
Fronts: Fronts are boundaries between different air masses with distinct temperature and humidity characteristics. Cold fronts typically bring cooler, more unstable weather, while warm fronts can bring milder, more humid conditions. Occluded fronts and stationary fronts are also important features on weather maps.
Weather Conditions: Symbols and color codes are used to indicate weather conditions at various locations on the map. For example, a sun symbol may represent clear skies, while a cloud with lightning bolts may indicate a thunderstorm.
Air Pressure Systems: Weather maps often show the positions and movements of high-pressure and low-pressure systems. Understanding the movement of these systems helps in predicting changes in weather conditions.
Tropical Systems: In regions prone to hurricanes and tropical storms, weather maps track the paths and intensities of these storms, providing critical information for storm monitoring and forecasting.
Frontal Boundaries: Weather maps show the locations of warm, cold, stationary, and occluded fronts. These boundaries play a crucial role in determining weather conditions in a given area.
Isobars: Isobars, lines of equal atmospheric pressure, help identify areas of high and low pressure. The spacing between isobars indicates the pressure gradient and can give an idea of wind speed and direction.
Climate Data: Some weather maps include historical climate data, such as average temperatures and precipitation levels, to provide context and compare current conditions with long-term averages.
Satellite and Radar Data: Modern weather maps often incorporate satellite and radar imagery to provide real-time information on cloud cover, precipitation, and severe weather conditions.
Warnings and Watches: Weather maps may include alerts for severe weather conditions, such as tornado watches, thunderstorm warnings, or hurricane advisories.
Air Masses: Weather maps identify the characteristics of air masses, such as maritime tropical (mT) or continental polar (cP), which can help predict weather patterns.
Understanding the information presented on weather maps is essential for meteorologists, weather forecasters, and anyone interested in staying informed about current and future weather conditions. These maps provide a visual representation of complex meteorological data, aiding in weather forecasting and decision-making for various industries and activities.
Decoding Weather Maps: What Key Information Do They Provide?
Weather maps are graphical representations of weather data that can be used to forecast weather conditions. They provide information about a variety of weather elements, including temperature, pressure, precipitation, wind, and clouds.
One of the most important pieces of information that weather maps provide is the location and movement of weather fronts. Weather fronts are boundaries between different air masses, and they can produce a variety of weather conditions, including clouds, precipitation, and thunderstorms.
Weather maps also show the location and intensity of high and low pressure systems. High pressure systems are associated with clear skies and fair weather, while low pressure systems are associated with clouds and precipitation.
Meteorological Cartography: Interpreting Data from Weather Maps
Meteorological cartography is the science of creating and interpreting weather maps. Meteorologists use a variety of tools and techniques to create weather maps, including satellite imagery, radar data, and ground-based observations.
Once a weather map has been created, meteorologists can use it to interpret the data and forecast weather conditions. To do this, they look for patterns in the data, such as the movement of weather fronts and the location of high and low pressure systems.
Weather Mapping: Insights Gained from Studying Weather Patterns
By studying weather maps, meteorologists can gain insights into weather patterns and trends. This information can be used to forecast weather conditions and to develop early warning systems for severe weather events.
For example, by studying the movement of weather fronts, meteorologists can predict where and when rain, snow, or thunderstorms are likely to occur. By studying the location and intensity of high and low pressure systems, meteorologists can predict whether the weather is likely to be clear, cloudy, or windy.
Weather maps are an essential tool for meteorologists and other weather professionals. By understanding how to decode and interpret weather maps, we can gain valuable insights into the weather and make better decisions about our daily lives.
Here are some additional insights that can be gained from studying weather maps:
- Tracking the movement of storms: Weather maps can be used to track the movement of storms, such as hurricanes, tornadoes, and thunderstorms. This information can be used to issue early warnings and to help people stay safe.
- Identifying areas at risk for severe weather: Weather maps can be used to identify areas that are at risk for severe weather events, such as floods, droughts, and heat waves. This information can be used to help people prepare for these events and to minimize the damage.
- Studying climate change: Weather maps can be used to study climate change and its effects on weather patterns. This information can be used to develop strategies for adapting to and mitigating climate change.
Overall, weather maps are a valuable tool for understanding and forecasting the weather. By studying weather maps, we can gain insights into weather patterns and trends, which can help us to make better decisions about our daily lives.