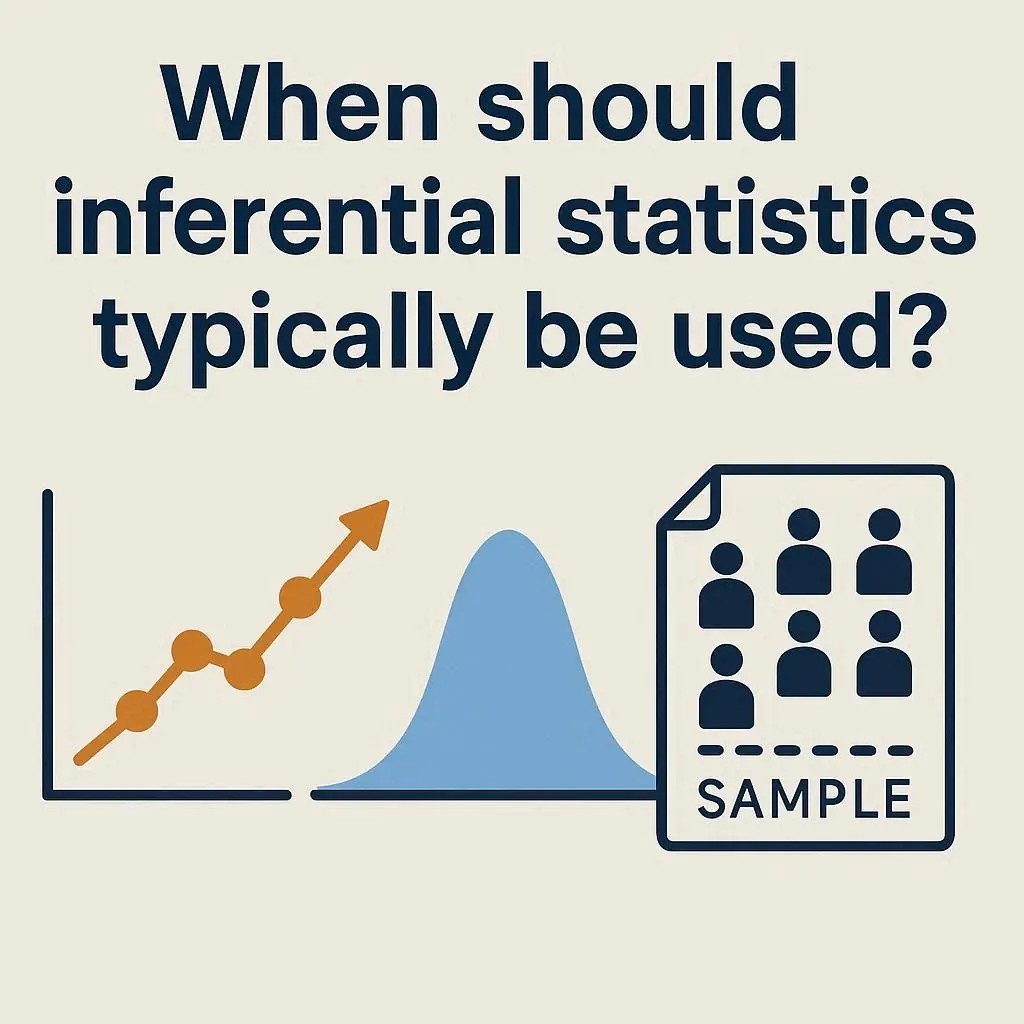
Making Smart Guesses From Small Clues
Inferential statistics is the science of using data from a small group to make educated guesses (or inferences) about a much larger group. It's how we move from "what we know" to "what we think is true."

The Core Idea: From Sample to Population
It's often impossible to study everyone or everything. So, we study a smaller, manageable 'sample' to understand the larger 'population'. This section explains when this approach is necessary and what its primary purpose is.
Population
(Everyone you care about)
Sample
(The group you study)
When should you use it?
- ➜ To test a hypothesis: You have a theory about a population (e.g., "this new drug lowers blood pressure") and need to see if your sample data supports it.
- ➜ To make predictions: You want to forecast future outcomes or behaviors based on past data, like predicting election results from polls.
- ➜ When studying the whole population is impractical: It would be too costly, time-consuming, or impossible to collect data from every single person or item.
Two Sides of the Same Coin
Statistics has two main branches. Descriptive statistics summarizes the data you have, while inferential statistics uses that data to make bigger conclusions. This comparison clarifies the unique role each one plays.
Descriptive Statistics
The Goal: To summarize and describe the features of a dataset you've collected.
- 📋 Asks: "What does my data look like?"
- 🔍 Focus: The immediate data sample.
- 📈 Output: Mean, median, mode, charts, graphs.
- 💬 Example: "The average height of students in this class is 5'9"."
Inferential Statistics
The Goal: To use sample data to make generalizations about a larger population.
- 🧠 Asks: "What can this data tell me about the world?"
- 🌍 Focus: The broader population.
- 💡 Output: P-values, confidence intervals, predictions.
- 💬 Example: "Based on this class, we are 95% confident the average height of all students at the university is between 5'8" and 5'10"."
Common Inferential Tests
Different questions require different statistical tools. Below are some of the most common tests used to make inferences. Click on each one to learn about its specific purpose.
T-Tests
▼Purpose: To compare the average (mean) of two groups to see if they are significantly different from each other.
Example Question: "Does Group A, which took a new medication, have a lower average blood pressure than Group B, which took a placebo?"
ANOVA (Analysis of Variance)
▼Purpose: Similar to a t-test, but used to compare the averages of three or more groups at once.
Example Question: "Do students from School A, School B, and School C have different average test scores?"
Chi-Square Test
▼Purpose: To determine if there is a significant association between two categorical variables (i.e., variables that fall into categories).
Example Question: "Is there a relationship between a person's favorite ice cream flavor (chocolate, vanilla, strawberry) and their gender?"
Regression Analysis
▼Purpose: To model the relationship between a dependent variable and one or more independent variables. It helps in understanding how one variable changes when others do.
Example Question: "Can we predict a person's salary based on their years of education and experience?"
From Data to Decisions
How does this all help in the real world? Inferential statistics provides a framework for making confident decisions under uncertainty. Follow this case study to see how a company uses sample data to make a profitable choice.
Case Study: The Website Button Test
An e-commerce company wants to know if changing their "Buy Now" button from blue to orange will increase clicks.
They can't show it to all users at once, so they'll run an experiment on a sample of 2,000 website visitors.